Satisfied guests, full tables, and hardworking staff: the key ingredients for success. Until you look at the bookkeeping and see that you’re barely making a profit. Nobody wants that.
Being able to view your revenue and costs on a daily, weekly and monthly basis allows you to respond quickly to potential issues and prevent them from escalating. It also helps you quickly assess the impact of your decisions and evaluate whether you're meeting your financial goals.
To provide you with these insights, Horeko is introducing the Financial Overview.-png.png?width=688&height=413&name=financial%20overview%20mockup%20(1)-png.png)
The Financial Overview
This new feature gives you a daily, weekly and Monthly overview in the form of a stacked chart. Essentially, this overview displays your profit and loss statement and includes the following components:
-
Total revenue
Revenue is imported through the POS integration and is shown excluding VAT.
As long as a dish can be matched (as in Menu Engineering), it will be included in the revenue.
Note: The revenue in the Revenue and Labor widget on your dashboard does include VAT.
-
Total Purchase costs
Similar to Menu Engineering, this is based on the sold quantities of ‘imported’ dishes. We use either the PLU code or dish names, which should be the same in Horeko as in your cash-register. So, make sure all your dishes are in Horeko with their respective PLU numbers. -
Gross profit
Gross profit is calculated by subtracting the total Purchase costs sold from the revenue. -
Total labour costs
Labour costs are only calculated if they are registered in Horeko. These are based on the clocked hours and employee contracts to calculate the total labour costs. -
Total fixed costs
You can manually enter fixed monthly costs via Management (Kitchen/ Employee) > Settings > Stores. Enter these per Store. -
Net profit
The net profit is what remains after deducting labour and fixed costs from the gross profit.
Getting Started
To ensure all data is correctly imported, it’s important that you have completed the following steps:
- Set up a POS integration
- Set up your Stores
- Entered your fixed costs
- Enter your operating days
- Updated the Purchase cost and PLU code.
- POS Integration
To use the Financial Overview, revenue data is required. This is imported via a POS integration and matched with the dishes in Horeko. Make sure that all dishes in the cash register are also listed in Horeko, including the cash register number
Manually importing POS data is not possible.If you don’t have a POS integration yet, check here to see if there is an existing integration with your POS system, or contact our Customer Support by email at support@horeko.com or call +31 (0) 88-7119711.
- Setting up Stores
For Kitchen and Full Suite customers:
Store provide an overview of your different businesses. To manage them, go to Management (Kitchen) > Settings and open the 'Stores' tab.
Click + New to add a new store.For Employee customers:
Stores provide an overview of your different businesses. To manage them, go to Management (Employee) > Settings and open the 'Stores' tab.
Click + New to add a new Store.This could be just one business, but if you have multiple, you can add them line by line. Then, link the department(s) from Employee to the Store.
If you only have Horeko Kitchen, link the department from your POS integration.It’s possible that the name of a department is the same as the Store name; this is not a problem. Just add the department and save.
Maybe you have a separate department for the Kitchen and one for Service. Add both to the relevant Store.If you have another restaurant, add that as well and link the correct departments.
Here is an example:
-
Fixed Costs
Entering fixed costs is done in the same place where you set up Stores. Each store has a column where you can enter the fixed monthly costs. The system will automatically process this information for you.Examples of fixed costs include rent/mortgage, insurance, phone, internet, water, electricity, loans, licensing fees, taxes, equipment purchases and maintenance, and other essential costs to keep daily operations running smoothly.
Unsure what your fixed costs are? Ask your accountant.
Note: The fixed costs entered remain in the system. As soon as you adjust the fixed costs, they will be applied from the first day of the following month and the new costs will be calculated.
For example, if €1000 has been entered for fixed costs and you adjust it to €1200 on 11 March, €1200 will be applied from 1 April. - Operating days
If you only want to see the revenue and costs for the days you are open, you can indicate this in the opening days. Tick the days you are open and untick the days you are closed and save the data. - Calculating Purchase costs (Available for Kitchen and Full Suite customers)
The purchase casts are automatically calculated, provided that your entire menu (including all dishes, sides, drinks, cocktails, etc.) is entered in Horeko. To ensure all dishes are properly imported, it’s recommended to assign a PLU code to each dish. This is not only helpful for the Financial Overview, but also for your Menu Engineering and Inventory Analysis. You can find instructions on how to do this here.
Once dishes are imported, they are included in the purchase cost calculation. The sold quantities are multiplied by the purchase costs which are based on the ingredients in the recipes, and then totaled.
Tip: Make sure to regularly update your ingredient prices so that you're always working with the most current data.
POS Insights
To view which POS data is used for the selected period, click on the POS Insights tab.
Here, you’ll find an overview of all POS data that is used to calculate the total revenue and purchasing costs.
It’s possible that some POS data is not included in the financial overview. This can happen for several reasons:
-
There are multiple dishes and/or menus with the same name
-
There are multiple dishes and/or menus with the same PLU code
-
There are no matching dishes and/or menus
To resolve this, you can use the Action column to match the dishes or get more information about which multiple dishes are involved.
The Financial Overview
At the top pf the page, you can select the desired day to view financial information. By default, all Stores are selected, but you can also choose to view data from one or more specific stores. You can also choose a day, week or month view.
The Chart
The chart is a stacked graph, where each layer represents a cost component. Additionally, there are lines for turnover and net profit. The chart shows an overview of your week (Monday to Sunday) or the whole month, and you can hover over it to see details per day.
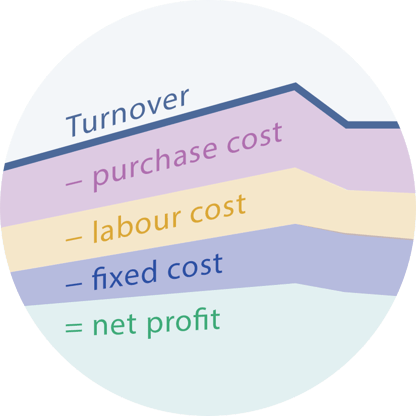
The structure of the graph, from top to bottom:
- Thick blue line: Total turnover
- Purple area: Purchase costs
- Yellow area: labour costs
- Blue area: Fixed costs
- Green line (and area): Net profit
To the right of the chart, you’ll find a summary of the selected day, displaying both percentages and amounts in euros.
You can read both the chart and the summary as a profit and loss statement. Starting with total turnover at the top. When you subtract the purchase costs, you get your gross profit.
From this gross profit, you then deduct labour costs and fixed costs, leaving the net profit.
Recalculating data
Data is collected from various sources to fill the financial overview. For instance, fixed costs come from the settings, labour costs from rostered and clocked hours and contracts, cost prices from your dishes and revenue from the POS link.
In the background, all this data is constantly calculated, up to 2 weeks back. After that, the retrieved data remains and is no longer calculated. If there have been no more changes in the various data points, in that case recalculation is not necessary. If you do miss data, for example because not all the POS data has been imported, you can choose to recalculate the specific day.
 Note, however, that once you choose to do this, the old data will be overwritten and cannot be retrieved. In addition, you also have to take into account changes in recipes (such as recipe composition), and that what is there now in terms of ingredients will be used for the calculations.
It is therefore important to check that. If in doubt, contact our support team.
The Table
Below the chart, there is a table that provides an overview of the stores in your database. Here, you can see the contribution of each store to the total turnover, costs, and net profit.
Who can see this overview?
To access the Financial Overview, the permission for a specific Role must be activated. You can check this in the permissions overview.

How the Financial Overview can help you
The information in your Financial Overview is, of course, interesting to look at, but how can you actually use these insights?
What your Financial Overview really shows is how financially healthy your business or businesses are.
Are you making a profit? Are labour costs rising too quickly? Or are the purchase costs too low or too high?
These are all signals to investigate further.
Take the time to carefully review your overview. Maybe you recognize a pattern, like turnover being higher every other Thursday. What happens on those days that leads to more turnover? Are specific employees working? Or is there a regular large lunch group?
Could you replicate this on other days? Perhaps it’s an opportunity to launch a marketing campaign?
The available data not only helps you spot patterns but also allows you to compare your performance with the market or with the goals you’ve set for your business.
Best practices for financial management
What are healthy numbers?
-
Cost of goods sold
A healthy ratio for a restaurant is between 25% and 35%. This indicator helps you optimize the cost of ingredients and ensure fair prices for your guests. -
labour costs
Ideally, this ratio should be between 30% and 45%, to balance labour costs with the turnover generated by your restaurant. -
Fixed costs
This refers to the ratio between income and essential operating costs such as water, gas, electricity, maintenance, rent, and insurance. These costs should ideally be between 10% and 20%.
These figures are estimates and may vary depending on the situation and location. Restaurant owners are advised to thoroughly research their own region and market.